Abstract In all the literature published so far, very impressive contour and colour plots have been shown demonstrating the power of GC×GC. These plots not only show the high separation power of GC×GC at enhanced sensitivities, but also exhibit the clustering and grouping of chemically related compounds, a valuable help in identification of separated components. Nevertheless, it is important not to overlook the peak shapes of individual peaks in GC×GC chromatograms. As is the case in 1D-GC, observing peak shapes in the chromatogram can help in understanding the separation phenomena under consideration, in optimizing the separation and in troubleshooting.
KeywordsThis article was written in cooperation with Jan Beens.
LevelBasic
In practice, GCxGC requires a mass transfer device called a modulator to periodically transfer first-column eluents to the second column. To be effective, the modulator must generate sharp, symmetrical peaks on the head of the second column for all compounds in the mixture. With other words, the modulator must perform three fundamental steps of modulation:
- Efficient trapping of the first column eluent in a short region of the modulator capillary column;
- Rapid release and re-injection of the trapped compounds onto the head of the second column,
- Rapid return to trapping conditions. Any malfunction of at least one of these steps will result in peak distortion. In the course of all the work on interface development that was done in several institutes, various and very different peak shapes have been observed.
It is true that, generally speaking, less attention has been devoted so far to discussing peak shape behaviour obtained by the new analytical technique. From a practical point of view, conditions should be selected in such a way that the GCxGC separation should allow the identification and quantification of the analytes of interest. Furthermore, the GCxGC advantages should be preserved, especially the ‘ordered’ chromatograms in the 2D-plot. These advantages are essential for many applications because of providing useful information for preliminary identification and characterisation.
The peak shape (and hence the overall separation) will be influenced by
- Modulation time
- Tailing phenomena in both columns
- Overload of both the columns
- Improper modulator temperatures
- a not properly tuned modulator.
In GC×GC, the separation achieved in the first-dimension should be preserved during modulation and separation in the second dimension. This implies that a peak eluting from the first column should be modulated at least four times, or, in other words, the modulation time should be about 1s of a first-dimension peak.
To demonstrate this, in the figure below a comparison is made of the separations of two flavour components (1-octene-3-one and 1-octene-3-ol) at four different modulation frequencies using a DB-1/BPX-70 column set. The two components cannot be separated in the second dimension when BPX-70 is used, which is due to the fact that both compounds have almost the same activity coefficients on this type of stationary phase. After separating these compounds in the first column and using a (very) long modulation time (12 s), the first-dimension peaks were only modulated 1–2 times. Because of the long modulation time, the already separated peaks were (partly) recombined in the modulator, and subsequently injected altogether into the second-dimension column. Under these conditions, only one spot shows up in the colour plot, demonstrating that the first dimension separation has been destroyed. Decreasing the modulation time to 8 s does not solve the problem completely; partial co-elution is still present.
First-dimension separation of 1-octene-3-one and 1-octene-3-ol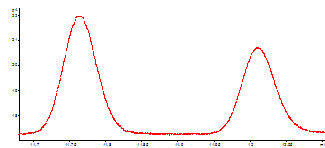
Effect of modulation time on preservation of the first-dimension separation.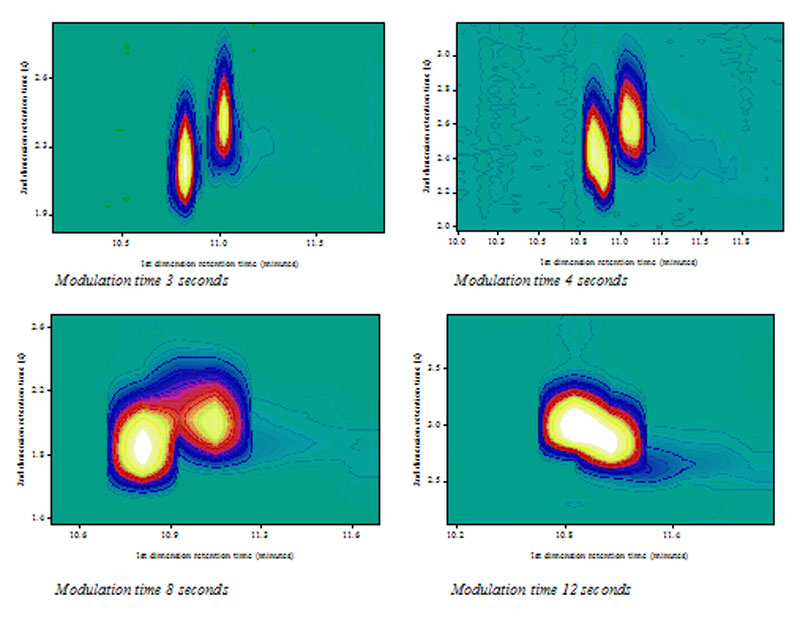
However, when using an even shorter modulation time of 4 or 3 s, which resulted in four modulations per (1D) peak, the separation obtained in the first dimension was adequately preserved and hence the spots of the two analytes are separately displayed in the colour plots. There are, of course, several ways to overcome this phenomenon:
 to use a short modulation time,
 - to enlarge the first dimension peak widths
- to use a narrower second-dimension column. This option may provide the best solution if the sample capacity does not present a serious problem as will be further illustrated in the next sections.
Tailing phenomenon and peak distortion caused by long second-dimension retention – wrap-around.
When components have retention times in the second-dimension column exceeding the modulation time, they will not elute in their own, but rather in a next second-dimension chromatogram. This effect is called “wrap-around”. It is clearly visible from the fact that the peak width of these components is far larger than surrounding peaks having far shorter second-dimension retention times. Co-elution of peaks from different modulation cycles will adversely affect the efficiency of the GCxGC separation and the ordered structure (if present) is lost. This effect is demonstrated below. ("Wrap around")
In spot number 14, pyrole, having a high affinity with the Carbowax secondary column, exhibits this “wrap-around” effect. Under the experimental conditions used, several peaks co-elute with pyrole. If the separation of the compounds under consideration is the goal of the analysis, it is evident to adjust the experimental conditions such that the modulation time exceeds the retention times of the compounds that are most strongly retained in the second dimension.
Wrap-around phenomenon and tailing peaks in the second dimension.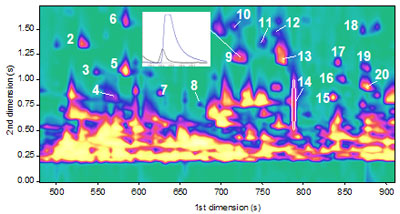
Blow-up of part of the GCxGC-ToF MS colour plot of a separation of cigarette smoke. The insert shows part of the second-dimension chromatogram, the co-elution of the small 3-methyl-1-butanol and the larger pyrazine. The latter peak shows a considerable tail in the second dimension, although this is hardly recognisable in the colour plot.
Note the large peak width of peak 14 (pyrole), which has a second-dimension retention time exceeding the modulation time of six seconds and exhibiting the “wrap-around” effect.
Tailing peaks in the first dimension.
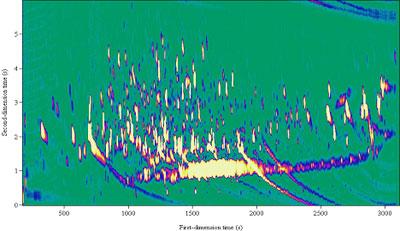 This figure shows a separation of an extract of sour cream. Two large curved “spots” are visible in the lower right corner of the colour plot. These spots represent the (large number of) second dimension peaks from two badly tailing peaks in the first dimension representing two organic acids (n-hexadecanoic and octadecadienoic acid ). In each next second dimension separation a small part of this first dimension tail is injected, and will be separated at a slightly higher temperature and thus exhibit a slightly lower retention.
Where in 1D-GC such tailing peaks in complex chromatograms generally present a serious analysis problem, viz. quantification of the tail and separation of peaks riding on this tail, in GC´GC this tail is separated from co-eluents and can be quantified quite easy.
In comprehensive two-dimensional GC:
- The second column needs to be very fast as to finish the separation within the modulation period of a few seconds. This means that the efficiency or separation power of this column is rather limited.
- Because of the high speed of the second column that is needed, the film thickness should also be very moderate and consequently the sample capacity is limited. Any loss in performance of this column will be critical for the success of the GCxGC process. Therefore, the influences of analytical conditions on the performance of the second-dimension column were studied.
Especially, the effect of overloading can deteriorate the resolution of peaks in two dimensions, and affect the two-dimensional separation by non-linear chromatography. Two cases of sample overload can be considered: that on the first column and that on the second column. Each of these cases leads to different two-dimensional peak shapes, which in turn influence data presentation in the form of contour plots. The spots will not be symmetrical anymore, but even worse, they will be broadened considerably, which eventually leads to the risk of (complete) overlap of components of interest. This is of high importance in applications where the compounds of interest are present at trace level in a complex matrix, of which the constituents are at much higher concentration.
Due to the fundamental differences in sizes (and speed) of the first and second columns, overloading the first column will almost always lead to overload of the second column as well. The effect of this double overload is fronting of these peaks in both dimensions (see peak A in Fig. 4). Note the normal peak shape of the minor (non-overloaded) peak B. Generally the apices of overloaded peaks shift to longer retention times.
Overloaded, fronting peak A in both dimensions. B is normally sized spot.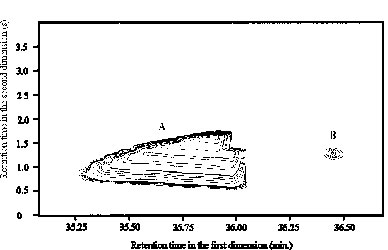
Depending upon the type of modulator several peak distortion effects can be distinguished. Phase-ratio modulators can only accommodate a limited amount of analyte in its (thick film of) stationary phase. Overload of analytes in the modulator will cause break through. Cryogenic modulators in general have accumulation capacities that are far higher than that of phase-ratio modulators. But cryogenic modulators must accumulate analytes at a sufficient low temperature. Here break through will occur at too high modulation temperatures. Break through can be very easily detected in contour or colour plots. In figure below a GCxGC separation of a vanilla extract, break through in the modulator of components is depicted by the intense white stripe in the middle of the plot.
Break through in the modulator caused by too high amounts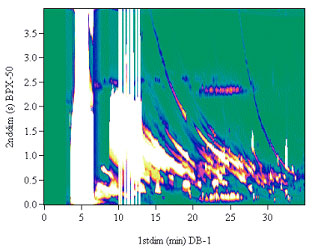
Break through caused by too high modulator temperature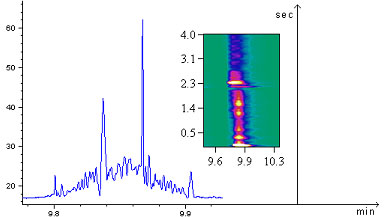
Break through with two jets
Another kind of break through in the cryogenic modulator with two jets is shown in the next figure below, which presents the peak of 1-octene-3-one modulated every 8 s. The upper colour plot and the corresponding original detector output (non-converted signal) represents a correct working dual-jet cryogenic modulator. The distance between the two jets was 5 cm and the linear carrier gas velocity is below 1.5 m/s. Under these conditions, the second-dimension retention time of 1-octene-3-one is about 6 s. Since the modulation time is 8 seconds, the peaks in the original detector output will be found 8 seconds apart. Note the tailing peak shape in the first dimension, which is also visible from the profile of the peak maxima in the original detector output. The lower colour plot and original signal show the result where the distance between the two jets is not long enough (3 cm), and/or the linear carrier gas velocity is too high. Under these conditions, the peak is split into two peaks, numbered 1 and 2, with a distance of exactly half the modulation time (4 s). The second-dimension retention time and the widths of peaks # 1 are similar to those in the upper chromatogram, while peaks # 2 are relatively broader and eluting 4 s later. That means that peaks # 2 form the break through material of 1-octene-3-one. An explanation of this phenomenon is as follow: there is a very short time delay between switching the CO2 valves and the effective cooling of the capillary. A part of this time delay is caused by the mechanical switching of the valve and another part is the time required for emptying and filling the capillary tubing between the valve outlet and the nozzle. This time delay is typically less than 50 ms. If the linear carrier gas velocity is (typically) around 1 m/s and the two jets are situated at least 5 cm apart, than this break through will not ![]() occur.
occur.
Break through in a dual-jet by too high gas velocity and/or a too short nozzle distance 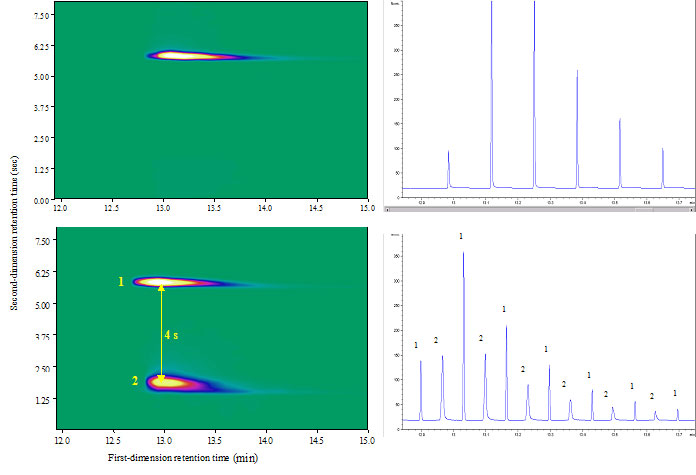 Break through effect in a dual-jet cryogenic modulator by a too high carrier gas velocity and/or a too short distance between the nozzles.
Break through in a four-jet modulator
Break through in the modulator and its cause can only be detected by plotting the individual second dimension chromatograms and inspecting the individual second dimension peaks. This is particular true for the improper trapping of analytes in the four-jet cryogenic system (two hot and two cold jets). Since the construction is such that the two cold and the two hot jets are placed quite close together in the same small chamber, they may influence each other. Applying the hot jet for a too long time, will prevent proper focusing of the analytes by the other cold jet as is shown here. The upper colour plot and a second dimension chromatogram (along the red dotted line in the colour plot) beneath it shows that when applying the hot jet for 300 ms or longer, will cause a part of a next fraction breaking through. When applying this hot jet for < 300 ms, the fractions are trapped and remobilized correctly (lower colour plot).
Break through of sample in a four-jet cryogenic modulator. 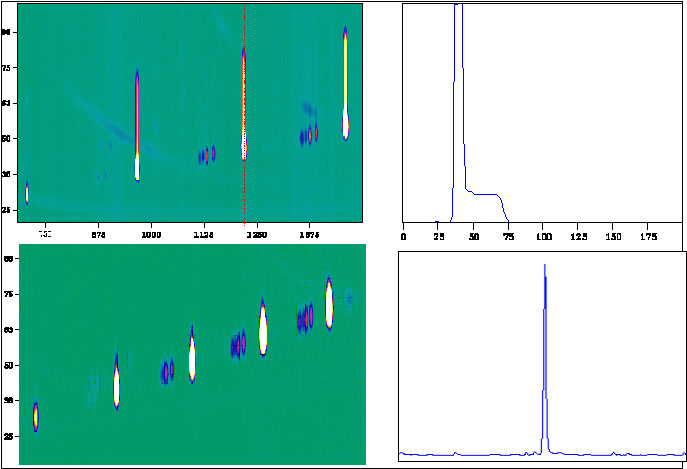
Accordingly, the same modulator can also be too cold, or the cooling time too long. When the temperature of the jet is too low (since liquid nitrogen is used, the temperature of the gas can be as low as -180°C) or the cooling time too long, the remobilization will be far more difficult and will need a longer time. Consequently, the narrow accumulated pulses will be elongated as is shown hereunder. This phenomenon can suddenly show up during a programmed analysis of which the first part is correct (around modulation number 300). It can simply be stopped by decreasing the cooling period (around modulation number 500).
Peak distortion four-jet cryogenic modulator by a too low jet temperature.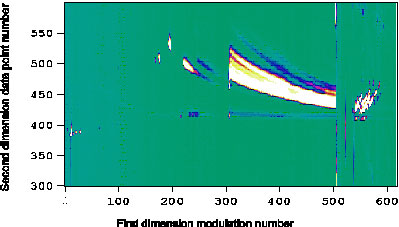
 Did you ever try to explain separation to your employees or students? Well, try no more: Lee Polite did it for you in a way which is hard to beat. We will open up one example of his whiteboard class. Click this link to watch the video. To see more, you can register here. Students and teachers can access free for one month. The links in the center column lead to hundreds of chapters with text, video presentations, visualisations and animations. The chapters on Analytical Chemistry 2.1 (David Harvey), as well as basics LC, GC (Harold McNair, Lee Polite and other experts) and spectroscopy chapters are on the level of colleges, laboratory schools and universities, all 'deeper' clicks lead you to more advanced knowledge on analytical techniques with all the details for in-depth understanding for professional users.
Chromedia is used globally by numerous colleges, universities and industries, our authors are ranked as the finest teachers in the world. So go ahead and discover Chromedia by getting a 30 days subscription, which is free for students and teachers. Chromedia functionalities work best on the Chrome browser. - Our expert team
- The Analytical Scientist
- American Chemical Society
- Wiley:
- separationsNOW
- spectroscopyNOW For full access to Chromedia: click here for a paid subscription.