LevelBasic
Advised for:
- Teachers in universities, colleges and lab schools who give courses in spectrometric basics.
- Students in universities, colleges and lab schools who take courses in spectrometry basics.
- Employees in industry who operate fluorescence instruments in routine and research environments with a need to understand the spectrometric technique they are using.
Fluorescence spectrometry is a fast, simple and inexpensive method to determine the concentration of an analyte in solution based on its fluorescent properties. It can be used for relatively simple analyses, where the type of compound to be analyzed (‘analyte’) is known, to do a quantitative analysis to determine the concentration of the analytes. Fluorescence is used mainly for measuring compounds in solution.
In fluorescence spectroscopy, a beam with a wavelength varying between 180 and ∼800 nm passes through a solution in a cuvette. We then measure – from an angle - the light that is emitted by the sample. In fluorescence spectrometry both an excitation spectrum (the light that is absorbed by the sample) and/or an emission spectrum (the light emitted by the sample) can be measured. The concentration of the analyte is directly proportional with the intensity of the emission.
There are several parameters influencing the intensity and shape of the spectra. When recording an emission spectrum the intensity is dependent on the:
- Excitation wavelength
- Concentration of the analyte solvent
- Path length of the cuvette
- Self-absorption of the sample
Fig 1. Fluorimeter scheme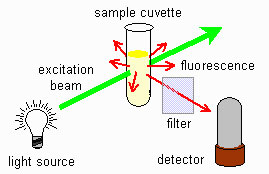
The figure shows a fluorescence schematic. The light source is in a 90 degree angle with the detector. The sample is located at the intersection of the two beam paths.
- Fluorescence analysis is suitable for analytes that can be dissolved in solvents like water, ethanol and hexane.
- The analytes need to absorb UV or visible light.
- The analytes need to emit visible or near infra red radiation
- With fluorescence analysis we can do quantitative measurements of a single analyte in solution (Or more than one analytes in solution provided thay do not interfere with each other.)
Unsuitable are:
- Analytes that have a photochemical reaction at (or above) the wavelength range of interest.
- Intransparent, not clear or colloidal samples.
- Compounds that do not show fluorescence
If an atom or molecule first absorbs energy – for instance a photon -, this is called excitation. Very shortly (in the order of nanoseconds) after excitation it emits a photon of a longer wavelength. We call that fluorescence. (We call it phosphorescence if the emission takes longer: in the order of (milli-)seconds.). This is shown in the following 4 minute video.
Only a relatively small number of compounds can fluoresce. Some non-fluorescent compounds can be made fluorescent by adding a fluorescent label. In general molecules that fluoresce have one or more aromatic groups in its structure.
Illustration electronic energy diagram
A molecule can be excited from its electronic ground state. In the electronic ground state the molecule has the lowest possible electronic energy. Upon excitation (the absorption of a photon) one of the electrons goes into an higher electronic state and the molecule is excited. The molecule will stay in its electronic excited state in the order of pico or nanoseconds (ns). Then the electron will fall back to its ground state and will emit a photon of a longer wavelength than the photon used for excitation.
Emission after excitation with UV light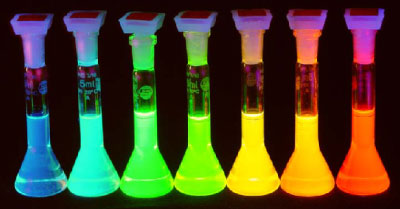 Different fluorophores, their structure and the emission
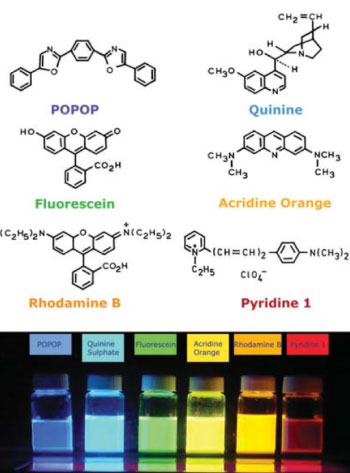
The following video gives a very nice introduction of fluorescence. It shows:
-
That we can use different colors of light (not only UV) to excite a molecule
-
An energy diagram and the light spectrum and some very nice experiments
-
Different color fluorescent solutions excited with different colors of light
-
Fluorescence caused by a chemical reaction and mechanical force or altered by temperature
-
The strength of fluorescence analysis, e.g. its low detection limit.
Atomic spectroscopy.
The previous examples all assume fluorescent molecules. But also atomic fluorescence is possible in solution. In environmental water samples the amount of mercury (Hg) can be determined via cold vapor atomic fluorescence spectrometry. In this method the water sample is pretreated to release all the mercury as vapor. The vapor is guided through a sample cell and via fluorescence the amount of mercury in the sample can be determinate. By measuring and comparing a series of standard solutions -with known concentrations - of the analyte, the concentration of the analyte in the sample can be determined. The most important condition for an accurate measurement is: the concentration of analyte in the sample has to be in between the highest and lowest concentration of a series of standard solutions.
Atomic spectroscopy is in practice mainly done by aspirating a solution with the analyte in a flame, oven or plasma like an ICP, an Inductively Coupled Plasma. We will come back to that type of analysis in another chapter.
Fluorescence is sensitive to influence of the solvent (or flame or plasma) and other outside factors. For example:
-
Changing the solvent can influence the shape and position of the fluorescent emission spectrum.
-
Also the interaction with other molecules than the solvent can change the fluorescent properties. Molecules than containing halogen atoms in its structure can reduce the amount of emission light. Big atoms/ions like iodine, bromine and chlorine causes quenching of the fluorescent emission. Halogens promotes that the excess of energy in the fluorescent molecule is dissipated via a non-radiative pathway.
This video holds an explanation of the fluorescence and quenching of the fluorescence of the quinine in tonic (3m49s).
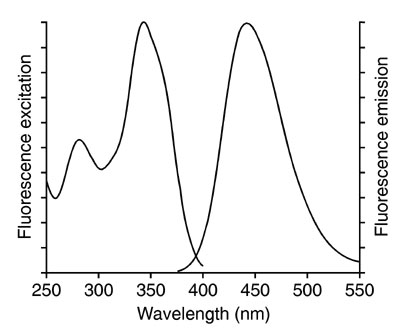
We can make an excitation (also called an absorption spectrum) and an emission spectrum of a fluorescent compound. The absorption spectrum tells us which incoming wavelengths are absorbed by the solution, with the emission or fluorescence spectrum we can see which wavelengths are emitted after absorbing the incoming light. In the figure below we see on the left side an excitation spectrum (200-400 nm) and on the right side an emission spectrum (375-550 nm) is shown. The x-axis shows the wavelength; The y-axis shows the intensity of the emission.Excitation (left) fluorescence spectrum (right)
In mixtures of fluorescent compounds both the excitation and emission wavelength can be a selection criterion.
More in depth theory can be found in Mary Kate: CH310 Chapter 15 Donais Slides 1-12