Abstract This chapter shows a series of LC chromatograms with some common problems and their solutions.
LevelBasic
This reversed phase column has been used for a long period of time. Chromatogram A is the original performance of this column, chromatogram B one of the last.
How can you explain the loss in efficiency?
What whould you do in this case? 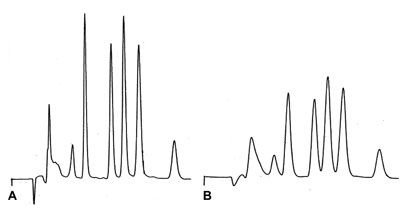
![]() Answer?
Answer?
Standard A has been analysed on an HPLC system with a manual injection valve. Result B should have produced the same result.
What could be an explanation for the different chromatogram? 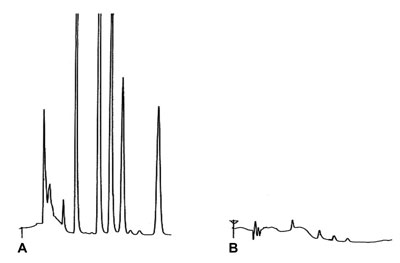
![]() Answer?
Answer?
This chromatogram is a routine analysis of some food additives (neutrals, organic acids and caffeine) on a C18 reversed pahse column (non-buffered mobile phase). Can you explain the poor peakshape of caffeine (peak # 3)?
Can you explain the poor peakshape of caffeine (peak # 3)? 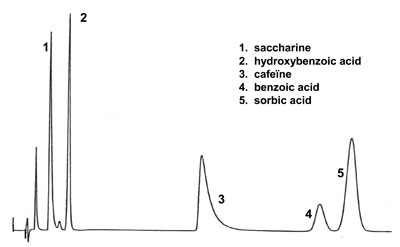
![]() Answer?
Answer?
This C18 reversed phase column should produce a test chromatogram (MeOH – water) as in chromatogram A. After some weeks of use the column performance is shown in B.
What is your explanation for the broad peaks? What can you suggest to solve the problem? 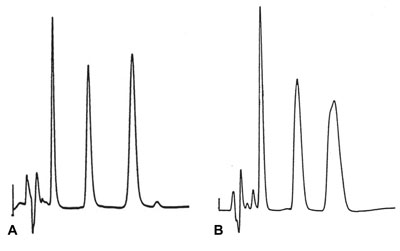
![]() Answer?
Answer?
A mixture of 3 steroids has been separated on a ChromSpher C18 column (Varian) under standard conditions. The expected result is chromatogram A. After some time this column has been replaced by a reversed phase Hypersil ODS column (Thermo), also a C18, 5 micron packing material. Chromatogram B is the result under exactly the same chromatographic conditions. What is wrong with the Hypersil column?
What is wrong with the Hypersil column? 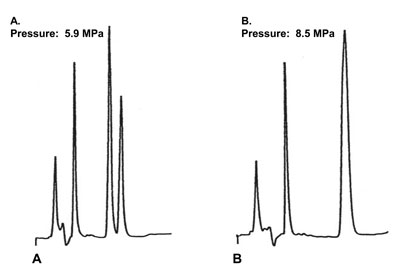
![]() Answer?
Answer?
Chromatogram A and B are the same type of sample components with some differences in concentrations. Meanwhile several samples has been analysed between these two runs. In chromatogram B some “ghost peaks” are visible.
What can be the origin of these extra peaks in run B? 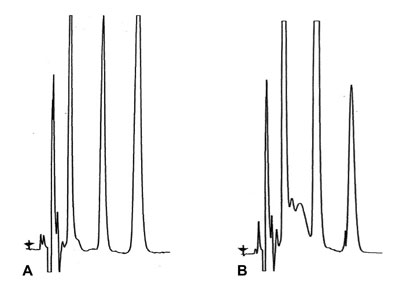
![]() Answer?
Answer?
During the day a large number of surface water samples have been analysed on this RPLC column. Chromatogram A is a standard of PAHs (poly aromatic hydrocarbons) at the beginning of the day, B the final run at the end. problem?
How do you explain the differences in performance? How can you solve this?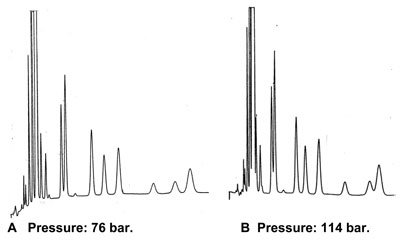
![]() Answer?
Answer?
Chromatograms A and B are test runs on the same RPLC column under neutral mobile phase conditions. Between A and B there was a leak in the system near the column, which was restored.
What is the problem in chromatogram B? 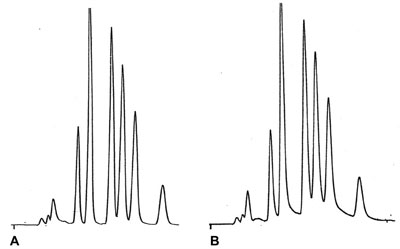
![]() Answer?
Answer?
After installation of the column this “blank” baseline is the result, using a standard UV detector.
What is going on here?! What would be your action? 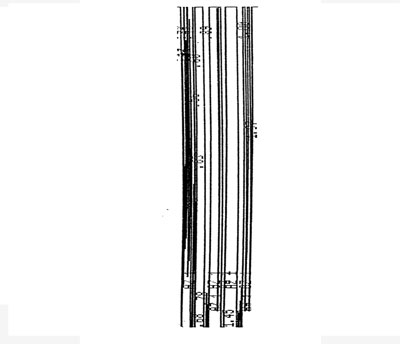
![]() Answer?
Answer?
After replacement of the mobile phase the baseline in this isocratic run is still quite poor. Also the peak width of the indicated peak is unexpected. The other peaks are normal.
Can you explain these effects in this chromatogram? 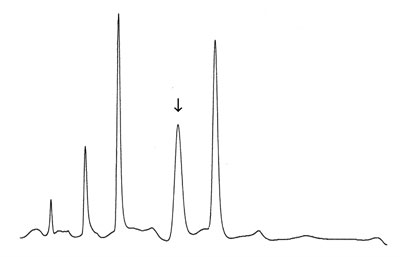
![]() Answer?
Answer?
The chromatograms here are from different runs and samples and are not as expected. In A the is a huge “hump” on the baseline. Chromatogram B has an extremely straight baseline.
What could be the explanations of these phenomena in A and B? 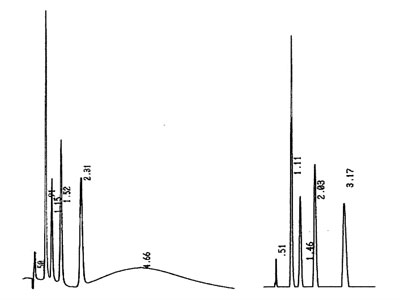
![]() Answer?
Answer?