Abstract The rationale for sample handling including the choice of the various sample preparation techniques with respect to their sensitivity and selectivity will be discussed.
Looking in a complex matrix for traces in the ng/mL to pg/mL range is just like looking for a needle in haystack. Since the samples are usually complex and ‘dirty’, isolation and quantitation of organic compounds – especially those present at low concentrations- in real life matrix is an analytical challenge. In order to achieve reliable chromatographic / electrophoretic data, relatively ‘pure’ samples must be analyzed, and therefore, ST/SP is an essential part of the separation procedure. The objectives of the method will indicate how much effort should be put into a ST/SP scheme. Some of the factors to consider are the concentration of the analyte, the matrix involved and the specificity required.
LevelBasic
The five basic rules for a successful Sample Treatment/Sample Preparation:
1. For method development it is important that:
- The objectives are clear,
- The chemistry of the analyte and any associated reactions is known
- Methods chosen are compatible with the technical expertise of the analytical staff and the available information.
- A balance is struck between the
 specificity that is obtained by the ST/SP scheme with that from the instrumental assay.
2. Understand that the ST/SP step can have several objectives:
- Removal of unwanted macromolecular (e.g. proteins) material and other interfering matrix components to improve the selectivity;
- Removal of material if the resolving power of the LC column is insufficient to separate all analytes present in the sample completely or in a reasonable time;
- Removal of material that can effect the chromatographic/electrophoretic resolution or repeatability of the total analytical procedure;
- Solubilization of compounds to enable injection under the initial separation conditions;
- Concentration of the analyte to improve the detection of the analyte with the analytical instrumentation;
- Improvement of the accuracy and precision of the total analytical procedure;
- Dilution of the sample to reduce solvent strength or to avoid solvent incompatibility;
- Removal of materials (e.g. solid contaminants) that can block the instrumental tubing, valves, column/capillaries or frits to increase the system’s lifetime;
- Stabilization of the analyte to avoid hydrolytic, microbiological or enzymatic degradation.
3. Understand that the objectives mentioned are constrained by:
- Physico-chemical properties of analyte (e.g., stability, pKa, Log D, etc.);
- Analytical techniques available;
- Human expertise available;
- Time;
- Matrices available
4. The aim of ST/SP procedures is to obtain a sample aliquot that is:
- Relatively free of interferences;
- Will not damage the analytical system;
- Is compatible with the intended
 separation method.
5. The requirements for a ST/SP procedure are:
- To provide a high
 recovery;
 - With a minimum number of steps;
- Where automation is relatively easy:
In summary this means that:
- The objective of the analytical procedure will indicate the effort required for a sample preparation scheme.
- Insufficient sample preparation will result in interferences during the analytical procedure & too much sample preparation will result in under-utilization of the instrument analysis.
We must realize that the goals for an analytical procedure can vary significantly:
Therapeutic-drug monitoring (TDM) is quite different from environmental monitoring and because the final goal is different also the methods of choice will be different.
In general environmental monitoring can be performed to determine:
- Amounts entering the environment;
- Effects on organisms and (eco)systems;
- Concentration effects over time;
- Trend modifications;
- Establishment of standard concentrations;
- Need for legislative controls;
- Activation of emergency procedures;
- Suitability determination of water and land resources.
This means that monitoring programs can be chosen dealing with:
- Pollution sources (e.g. emission rates);
- Transport mechanisms;
- Target analytes (including speciation).
It will be obvious that TDM and environmental monitoring are completely different: the objectives are different and with that the sampling, SP procedures and the analysis will be different.
Sampling and SP procedures are not linked to an analyte, but linked to a certain ![]() problem.
problem.
Methods and procedures tend to be developed for individual applications as such, and so the sampling and SP step should be tailored to the requirements of the method.
For different types of samples different strategies should be used, e.g:
- In bio-analysis, with sample volumes of 0.1-1 mL, the majority of the procedures are nowadays performed in an off-line mode with the separation using, for example, disposable cartridges.
- For the treatment of larger sample volumes, i.e. environmental samples with sample volumes of 10-1000 mL, usually on-line procedures are preferred.
- The sample size strongly depends on the amount of the available sample (e.g. limited in bio-analysis) as well as the combination of analyte concentration in the sample and the limit of determination.
- Although for the analysis of large samples on-line procedures are to be preferred in terms of repeatability, off-line systems may also be used.
- For the treatment of pharmaceutical formulations, the strategy will be quite different compared with the strategy for biological samples. In pharmaceutical preparations (e.g., creams, syrups, ointments, tablets), in principle, one single analyte in a relatively high concentration, should be determined in a matrix consisting of a limited number of components.
In developing a suitable procedure a number of features should be considered such as the:
Physico-chemical parameters:
- Physico-chemical properties of the analyte(s);
- Chemical and physical composition of the matrix;
- Degree of analyte-matrix binding(e.g., drug-protein binding, binding to humic substances);
- Analyte stability during sampling and SP procedures;
- Presence of interferences from sample or containers used during sampling, storage or transport, or SP.
Techniques and expertise in the laboratory:
- Available techniques – both with respect to sampling and SP and separation/detection – in a laboratory;
- Expertise available in a laboratory;
Time available to develop a method.
Optimization of sample ![]() treatment:
treatment:
- Recovery during the analytical procedure should be as high as possible (preferably over 75%);
- Compatibility of solvent used during the final SP step and the conditions used during the injection of the sample into the separation system;
- Simplicity of the applied techniques,
- Repeatability and reproducibility of the methods used;
- Possibility of concentrating (enrichment) of the analyte(s) during the final SP technique.
Another parameter that is of importance is the fate of the analyte. This means if the free or the bound fraction of the total amount should be determined. Analytes can be bound to proteins or humic substances. This can be problematic in a number of cases. An example is the sorption of the pesticide 2,4-dichlorophenol to soil with different concentrations:
Sorption of 2,4-dichlorophenol to lOESS soil with different concentrations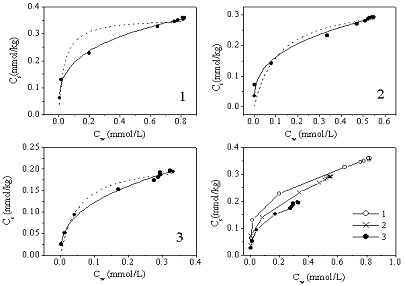 www.chemistrymag.org
With respect to the stability of the analyte during the sample preparation process sample losses should be taken into account:
- losses due to the influence of light, dissolved gases, heat or adsorption – are normally more pronounced in dilute than in concentrated solutions.
- In particular the pH is of major importance for the stability of quite a number of solutes.
- Problems caused by contaminants, e.g. plasticizers, optical brighteners in paper tissues, fibres from laboratory coats, are well known.
- Since these effects affect the reliability of the assay, optimizing the overall recovery is a necessity in order to obtain a good sensitivity and proper accuracy and precision.
- Another major problem is the cleaning of glassware. To avoid any problems ultrasonication should be part of every cleaning procedure.
The new ![]() developments, in the last years, in sample clean-up methods are closely related to the development of new sorbent materials in LC, which allow the direct injection of, for example, plasma samples, the introduction of automated sample processors, and the application of robotic systems.
developments, in the last years, in sample clean-up methods are closely related to the development of new sorbent materials in LC, which allow the direct injection of, for example, plasma samples, the introduction of automated sample processors, and the application of robotic systems.
One of the present and future trends in chromatography and electrophoresis is miniaturization; although the concentration sensitivity is limited it will be a major topic in analytical chemistry, especially for the separation of HMW compounds. Therefore, automated pre-column switching systems which can be used for the preconcentration and clean-up of aqueous samples in combination with micro bore or narrow bore technology and chip technology will be discussed elsewhere in this topic.
Guidelines for method choice in analytical chemistry
The necessary sampling and SP steps for the determination of analytes in a complex and dirty matrices is one of the most troublesome to perform, and therefore, the degree of SP depends on quite a number of parameters. The most important ones are the:
- Concentration of the analyte;
- Composition of the matrix;
- Number of samples to be analyzed;
- Chosen separation / detection system.
This paragraph presents general guidelines for separation method selection. To simplify the tables only organic molecules with a MW of less than 1 kD are taken into account. This means that some of the separation techniques mentioned earlier e.g. SEC are not taken into consideration. (HP)TLC means that in case quantitative or semi-quantitative results should be obtained high-performance TLC (HPTLC) should be used instead of classic TLC. The abbreviations used are explained in the 'List of abbreviations and glossary of symbols'.
Tables: Guidelines for method choice in analytical chemistry.
| Questions to be answered: | Possible techniques: | |
| Aggregation phase: | Gas | GC, SFC |
| Liquid / solid | CE, GC, IEC, LC, OPTLC, (HP)TLC, SFC | |
| Charge: | Not present | GC, LC, MECC, OPTLC, (HP)TLC, SFC |
| Present | CE, IEC, LC (IP, IS) | |
| Functional groups: | Not present | Almost no derivatization possibilities |
| Present | Derivatization potential | |
| Polarity: | Low | Non-polar sorbents in chromatography |
| High | Polar sorbents in chromatography | |
| Saturations (aromaticy): | Aliphatic | AMP, CL, CON, ECD, FID, FS, IR, NMR, NPD, PID, POL, RI, SIM, |
| Conjugated / aromatic | AMP, CIF, CL, CON, ECD, FID, FS, IR, LIF, NMR, NPD, PID, POL, RI, SIM, UV-VIS | |
| Solubility: | Polar solvents | CE, IEC, LC, OPTLC, (HP) TLC |
| Non-polar solvents | GC, LC, OPTLC, (HP)TLC, SFC | |
| Volatility: | Low | CE, IEC, LC, OPTLC, (HP)TLC, SFC |
| High | GC, LC, SFC |
| Complexity of the matrix: | Degree of automation, amount of effort: | |
| Analyte - matrix binding: | None | No special precautions |
| Yes | Denaturation procedures should be used in case of drug -protein binding or other analyte - matrix disrupting techniques | |
| Minimum detectable concentration(s): | 1 - 1000 μg/mL | CE, GC, LC, OPTLC, (HP)TLC, SFC, AMP, CIF, CON, ECD, FID, IR, NMR, NPD, PID, POL, RI, SIM, UV-VIS |
| 1 - 1000 ng/mL | CE, GC, LC, OPTLC, HPTLC, SFC AMP, CIF, CL, ECD, LIF, NPD, PID, SIM, UV-VIS | |
| 1 - 1000 pg/mL | CE, GC, LC, SFC, AMP, CIF, CL, ECD, LIF, SIM | |
| 1 - 1000 fg/ml | CE, LC, (SFC), CL, LIF | |
| Stability: | Bad | Stabilizing procedures |
| Good | No stabilizing procedures needed |
| Availability equipment: | Determines choice of SP / ST, separation / detection system | |
| Available expertise: | Determines choice of system components and the degree of automation | |
| Number of solutes to be determined | < 10 | CE, GC, LC, OPTLC, SFC |
| > 10 | CE, GC, LC | |
| Number of samples to be analyzed in each series: | Degree of automation | |
| Number of sample series to be analyzed | Degree of automation | |
| Profiling of analytes: | Yes | CL-MS/(MS), GC-MS/(MS), LC-FTIR, LC, NMR, LC-DAD |
| No | No restriction in separation / detection mode | |
| Rationale for analysis | Qualitative | CE, GC, LC, OPTLC, SFC, TLC |
| Semi-quantitative | CE, GC, LC, OPTLC, SFC, TLC | |
| Quantitative | CE, GC, LC, SFC | |
| Reason for analysis: | Legal | Reliability most important parameter |
| Toxicological | Speed most important parameter | |
| TDM | Throughput important parameter | |
| Drug development | Screening and identification of metabolites important parameters | |
| Ruggedness of the method | High | CE-DAD, GC-ECD, GC-FID, GC-NPD, LC-CIF, LC-DAD, automated reaction / detection systems |
| Low | No restrictions | |
Sample preparation / treatment can be considered as a number of unit operations, each of which capable of a specific task. An overview of SP techniques that can be used is given in the table in this paragraph. These procedures can be categorized into four groups:
- Group 1. Initial techniques: sampling, stabilization, storage, solubilization and release of analyte from the biological matrix;
- Group 2. Procedures sample handling: addition, mixing, separation, or removal of liquids;
- Group 3. Selective techniques: removal of interfering endogenous solutes;
- Group 4. Selectivity and/or sensitivity enhancement.
In order to develop an analytical procedure suitable for routine trace analysis, normally a combination of several steps must be chosen. A general approach is presented in the Guidelines in the previous paragraph (Guidelines for method choice). This approach will be extensively discussed in the last section of this Topic where some extended guidelines are given how to use a strategy for the development of analytical procedures.
In principle, an analytical procedure should consist of one or more initial and selective steps, and because normally a procedure should be developed possessing a certain accuracy, precision and repeatability these steps should be incorporated into the total analytical procedure. This can only be achieved if the selectivity and sensitivity of the procedure are guaranteed, which means that relatively clean samples should be analyzed.
| Group1: | Procedures for initial sample | preparation |
| Dialysis | Acid-catalyzed | |
| Hydrolysis | Base-catalyzed, | |
| Enzymatic (Protease, Lipase, Glucoronidase, Sulfatase | ||
| Precipitation | Organic solvents Inorganic salts, Acids, Ammonium sulfate | |
| Saponification Ultrasound Microwaves (Ultra)filtration | ||
| Group2: | Procedures for liquid handling | |
| Evaporation Centrifugation Dilution Filtration Freezing Lyophilization Mixing Pipeting Salting-out | ||
| Group3: | Selective sample treatment | techniques |
|
Liquid-liquid extraction (LLE)
Solid-phase extraction(SPE) Liquid Chromatography | ||
| Group4: | Enhancement of assay selectivity | and/or sensitivity |
| Pre-column derivatization | ||
| Post-column derivatization | Enzyme reactors Solid-state reactors Ion-pair reactors Photochemical reactors |
In principle, a combination of a non-selective (initial) step, to stabilize, to concentrate or facilitate storage of the sample (e.g., protein precipitation, dialysis, ultrafiltration, freezing) and a selective step (e.g., LLE, SPE) to isolate the sample will be necessary.
Protein dilution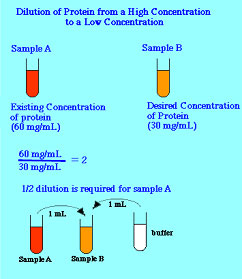 www.miramar.sdccd.netIn actual practice the difference between initial and selective steps is not sharp. LLE, for example, can be used to denaturate proteins (initial procedure) and at the same time to isolate the analyte (selective procedure), and by using switching valves this non-selective and selective techniques can be combined in a single automated system:
 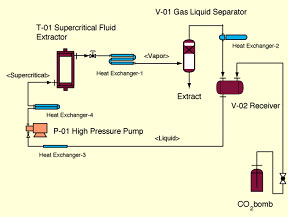 Supercritical extraction as an example of a selective procedure (www.kobelco-co.jp).
The applicability of most of the ST/SP techniques is limited to liquids or dissolved samples. In this table a number of frequently used techniques are given and it is indicated if these techniques can be used for gaseous, liquid / dissolved or solid / semi-solid samples:
| Gases | Liquids | Solids | Semi-solids | ||
| Filtration | Particle- | X | |||
| Micro- | X | ||||
| Ultra- | X | ||||
| Reversed osmosis | X | ||||
| Extraction | Liquid-liquid | X | |||
| Solid-phase | X | X | X | ||
| Supercritical | X | X | X | ||
| Thermal | X | X | |||
| Headspace | Static | X | X | X | |
| Dynamic | X | ||||
| Dialysis | Diffusion | X | |||
| Electrodialysis | X | ||||
| Centrifugation | X | ||||
| Electrophoresis | X | ||||
| Solubilization / | Microwaves | X | |||
| dissolution | Ultrasound | X | |||
| Chromatography | Adsorption | X | |||
| Partitioning | |||||
| GC | X | X | X | X | |
| LC | X | ||||
| SFC | X | X | X | ||
| IE | X | ||||
| SEC | X | ||||
| Capillary electrophoresis | X |
A different division of ST/SP techniques in which either non-selective or selective phase-transfers are used is given in the Table hereunder:
| Non-selective phase-transfer techniques | Selective phase-transfer techniques |
| Microwave | Gel-filtration chromatography |
| Headspace | Solid-phase extraction |
| Supercritical extraction | Ion-exchange chromatography |
| Thermal extraction | Liquid-liquid extraction |
| Thermal desorption | Dialysis |
|
| Column-switching techniques |
Relation between sample preparation and analytical instrumentation. The next table is providing an interesting overview on the techniques that can be used for various types of analytes and the most obvious sample preparation and analytical ![]() techniques.
techniques.
| Analyte(s) | Sample preparation | Instrumentation |
| Organics | Extraction, concentration, clean-up, derivatization | GC, LC, GC-MS, LC-MS |
| Volatile organics | Transfer to vapour phase, concentration | GC, GC-MS |
| Metals | Extraction, concentration, speciation | AA, GFAA, ICO, ICP-MS |
| Metals | Extraction, derivatization, concentration, speciation | UV-VIS, IC |
| Ions | Extraction, concentration, derivatization | IC, UV-VIS |
| DNA/RNA | Cell lysis, extraction, PCR | Electrophoresis, UV-VIS, fluorescence |
| Amino acids, fats, carbohydrates | Extraction, clean-up | GC, LC, electrophoresis |
Another important parameter is the time needed for the total analytical procedure. The total analysis time is the sum of the numerous different steps involved in the whole procedure:
| tsampling + tpreservation + tsample log-in + tsample pretreatment + |
This means that the overall analysis time strongly depends on the number of steps involved. On its turn this means that the type of steps, or operations, involved is of importance for the overall analytical performance. As a result the use of selective procedures certainly will have a positive effect on the overall performance of an analytical procedure and the overall ![]() analysis time.
analysis time.
 Sample preparation operations.
The techniques mentioned in group 4 (Enhancement of assay selectivityand/or sensitivity) are mainly focused on derivatization of an analyte to enhance the assay sensitivity and specificity such as pre-column derivatization reactions and post-column derivatization and reaction ![]() detectors.
detectors.
Although, in principle, selectivity and sensitivity are separate ![]() analytical variables, they are connected in practice. For example, when an assay for an aqueous sample (e.g., urine, surface water) is developed and validated at the ng/mL level, down scaling to the pg/mL level may result in unexpected interferences in the chromatograms electropherograms. So as a result, selectivity should be optimized again.
analytical variables, they are connected in practice. For example, when an assay for an aqueous sample (e.g., urine, surface water) is developed and validated at the ng/mL level, down scaling to the pg/mL level may result in unexpected interferences in the chromatograms electropherograms. So as a result, selectivity should be optimized again.
Sensitivity / selectivity issues are different in detectability of the analyte but also regarding the total analytical procedure:
- Qualitative: Is the analyte present or not?
- Quantitative: How much of the analyte is present?
- Semi-quantitative: Is the concentration above or below the threshold level?
Selectivity versus sensitivity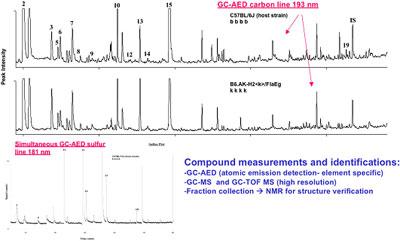 www.indiana.edu Regarding sensitivity of an analytical procedure it is necessary to provide some definitions. Quantitation, using separation techniques, nearly always means calibration versus a standard as can be seen here:
Calibration in separation science using an (internal) standard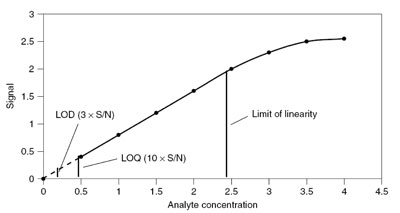 Sample Preparation Techniques in Analytical Chemistry, S. Mitra, Wiley, 2003
The sensitivity of a method is defined as the defined as the ability to distinguish between small difference in analyte concentration at a desired confidence level. This means measuring the slope of the calibration curve.
In practice the limit of detection (LOD) and limit of quantitation (LOQ) are frequently used. The ![]() LOD is defined as the minimum detectable concentration or amount in a standard aqueous solution, and the LOQ as the minimum detectable concentration or amount in the real matrix:
LOD is defined as the minimum detectable concentration or amount in a standard aqueous solution, and the LOQ as the minimum detectable concentration or amount in the real matrix:
Limit of quantitation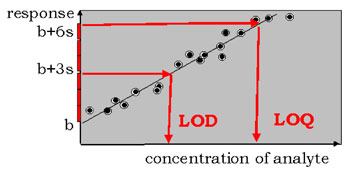 www.antoine.frostburg.edu In the literature a number of definitions can be found. In practice this means the concentration where the signal-to-noise ratio reaches an acceptable value.
The LOD is usually defined as:
mean blank ± 3sblank.
However, in complex matrices a better value seems to be:
mean blank ± 10sblank.
The LOQ is usually defined as:
mean blank ± 6sblank or mean blank ± 10sblank.
Another important parameter that can be determined from the calibration plot is the limit of linearity (LOL). This is the point where the calibration curve becomes nonlinear.
The recovery (%) is a frequently under-estimated parameter in chemical analysis. Low recoveries, during sampling and SP, normally means a negative effect on quantitative issues as LOD, LOQ and LOL. The result is that high recoveries (> 80%) and ![]() constant recoveries are of utmost importance.
constant recoveries are of utmost importance. 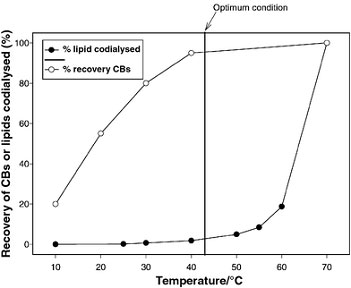
Temperature dependence of dynamic dialysis. Absolute recovery of mixture containing the 14C-CBs 122, 126 and 169, as a function of dialysis time; diffusion of lipids though membrane as a function of dialysis time (www.rsc.org).
High recoveries certainly will help to improve the detectability of an analyte. Other possibilities are the use of:
- Selective detection modes (e.g. fluorescence, mass spectrometry);
- Specific detection modes (e.g. bio-specific detection);
- Multidimensional separations (e.g. column switching);
- Derivatization procedures.
An example of using multidimensional separations in combination with selective detection approaches is given below. In the example the hyphenation of LC with a bio-specific assay and MS shows that fully integrated systems can be constructed that allow the simultaneous determination of biological (e.g., affinity, IC50 values, selectivity) and chemical (e.g., concentration, molecular mass, accurate mass, structural information) data.
On-line combination of a reversed-phase LC separation with an acetylcholine-esterase assay and MS detection. 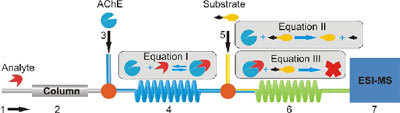
The use of the LC-MS systems provides the possibility to follow precisely what happens with the concentrations of the analyte, the enzyme, substrate and the products formed. This because the MS can be tuned to the exact m/z values of the compounds and their fragments.
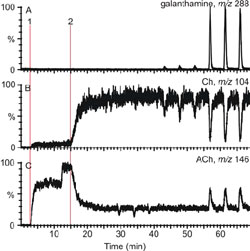 The resulting MS traces of the on-line acetylcholine esterase assay mentioned above. In this figure 1 means the addition of the substrate and 2 the addition of the enzyme. The concentration of the analyte (galanthamine) can be measured by evaluating the m/z value of 288 and at the m/z values of 104 and 146 the fragments formed during the reaction can be observed.
Obtaining lower LOD values in increasingly complex samples means that stringent demands are placed on the resolving power of separation systems. Improved resolution can be obtained by changing the:
- Plate number (N);
- Selectivity (α);
Retention parameter (k’)
Improving the separation efficiency can be done by improvement of peak capacity which is the “Maximum number of components (n) that can be placed side by side in the available separation space with a given resolution which satisfies the analytical goals”. The Equation to determine the peak capacity is: ![]()
In this Equation is r the number of standard deviations taken as equaling the peak width (typically 4) and k’i the retention parameter of the last peak in a series. For a column LC system the total peak capacity is given by:
![]()
where x is the number of identical columns used, yielding a coupled system which is only equivalent to a longer linear system
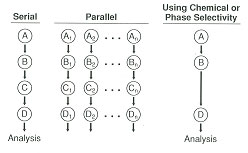
Using orthogonal systems, for this purpose, the amount of cross information is minimized and the amount of component information is maximized:
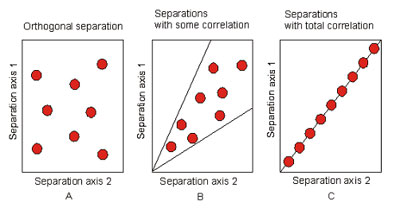 Orthogonal separation systems.
Finally the use of derivatization procedures can result in enhancement of the sensitivity / selectivity or specificity by using pre-column derivatization, on-column labeling or post-column tagging procedures.
The terms selectivity and specificity are normally the reason for confusion. However, as can be seen in the statement (www.iupac.org) these terms are not equivalent to each other and scientist should take good care of using the proper terms an definitions during their research and in the corresponding reports.
A special sample treatment technique is derivatization. Fitting a derivatization step into a complete analytical procedure, in a harmonious way, is one of the major analytical challenges. Derivatization procedures are not only used to improve the detectability, but also to change the polarity of the analytes to facilitate either the ST/SP or the chromatographic / electrophoretic separation. An example is the determination of phase II metabolites. These types of compounds normally have a relatively polar character, which means that a liquid-liquid extraction (LLE) or solid-phase extraction (SPE) is problematic. Derivatization can transform these compounds into less polar products which can be more easily extracted.
Aqueous biological matrices such as plasma, serum, urine, tissue homogenates, and saliva contain a multitude of endogenous compounds. Examples are proteins in plasma samples and fatty acids in urine samples. These solutes are often present in much higher concentrations than the analytes or their metabolites. Many of these endogenous compounds have reactive functional groups (e.g. the carboxylic acid function of amino acids and fatty acids) which can participate in the derivatization reactions and can interfere with the analysis of the compounds of interest, if not sufficiently separated by the ensuing separation procedure(s). Furthermore, most derivatization reactions are best performed in non-aqueous solvents and the presence of an anhydrous medium may even be obligatory. The injection of non-aqueous samples into certain separation systems – i.e. reversed-phase (RP) LC or CE – is in some cases not compatible with the applied system and in other systems the injection of (semi)aqueous samples – e.g. normal-phase (NP) LC – may be troublesome.