Abstract HPLC separations are effected with liquid mobile phases flowing through a column packed with a solid stationary phase. The chromatograms of these separations are characterized by the retention and resolution of analyte peaks, as well as their selectivity and plate number (efficiency). An animation shows this principle.
LevelBasic
Good chromatographic separation results in sufficient difference in retention between individual sample components and chromatographic peaks not being too close together. Chromatographic resolution is determined by a number of parameters. A number of parameters influence the separation. Some are related to the retention time, others cause a peak to broaden. The most important are (click on the terms to link to the paragraphs):
- Retention time tr
- Retention factor
 (k)
(k) - Selectivity (α) tells us about the difference in retention between the individual components (calculated by the ratio of their retentions).
- Resolution. The separation between peaks is expressed by the resolution factor Rs, which is related to the
 extent of peak overlap in the chromatogram.
 - Theoretical plate number Nth describes the relationship between retention time and peak width and defines column performance and separation power.
- The plate height H also defines the culumn performance. The plate height is inversely proportional to the plate number: H = L/Nth. A small plate height leads to narrower peaks.
- Sometimes the term "Efficiency" is used, however this is not formally defined by IUPAC. We advise to use the plate height or the plate number.
To describe each contribution in detail, several so-called plate height equations have been developed. For LC, the best known is the van Deemter equation.
Every sample injected onto a column will take a finite time to travel through the column.
- If there is no affinity of the sample components for the stationary phase, the time between applying the sample and its elution from the column will only depend on the speed at which the mobile phase is flowing through the column, and the column dimensions. The time taken for elution of an unretained sample component is therefore called the 'void', 'hold-up' or 'dead time' time (t0) of the column.
- Sample components that exhibit some degree of affinity for the stationary phase will spend some time in the stationary phase and are retained on the column longer than the hold-up time. The time the sample component spends in the stationary phase is called the adjusted or net
 retention time (tr').
 - The time between injection and elution of a retained sample component is called the retention time (tr) for that particular component. The retention time is the sum of time a sample component spends in the mobile phase and the amount of time it spends in the stationary phase. The fundamental relationship describing retention in chromatography (both gas and liquid) is: tr = tr' + t0.
Retention in chromatography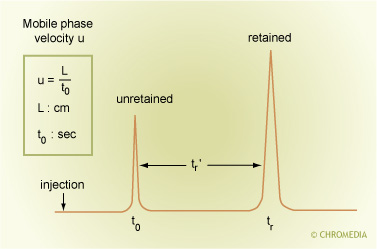
The interaction of the component with the stationary and mobile phases, the mobile phase velocity, ![]() flow, column length and temperature all influence the separation. The velocity (u) of the mobile phase in the column can be
flow, column length and temperature all influence the separation. The velocity (u) of the mobile phase in the column can be ![]() calculated easily from the column hold-up time: u = L/ t0, where L is the column length in cm.
calculated easily from the column hold-up time: u = L/ t0, where L is the column length in cm.
The retention factor is a variable indicating how much time a component spends in the stationary phase compared to a non-retained component. The chromatographic system (mobile and stationary phase) can be regarded as a system of two immiscible phases. When there is sufficient interaction, a sample component will be distributed between the two phases. The term k indicates the ratio of the dissolved component in both phases and is called the retention factor.
Retention factor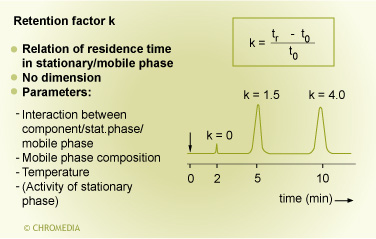 The ratio of the net retention time to the retention time of an unretained peak, tr'/ t0 is called the retention factor (k) of a component on the column under the conditions used for the analysis. In more detail: The period of time that the sample component resides in the stationary phase relative to the time it resides in the mobile phase. It is calculated from the adjusted retention time divided by the hold-up time
k =( tr - t0)/t0
where tr is retention time for the sample peak and t0 is the retention time for an unretained peak.
The retention factor and the retention time can both be used to describe the chromatographic behavior of a sample component in a column. The retention factor is a relative value (![]() dimensionless).
dimensionless).
- k = zero means that a sample component spends 'zero times' longer in the stationary phase than in the mobile phase. In other words: the component does not spend any time in the stationary phase and it therefore is not retained.
- k = 1 means that the component spends just as much time in the stationary phase than in the mobile phase. The retention time is twice the column hold-up time. The peak in the chromatogram appears at 2 times t0.
- k = 4 means that the component spends 4 times to in the stationary phase and a mobile phase time of one time t0. The total retention time is 5 times to. The peak in the chromatogram appears at 5 times the distance t0.
The advantage of using the retention factor, rather than the retention time is the fact that the retention factor is independent of the column length and the flow rate of the mobile phase.
The k-value of a component in a given chromatographic system can be readily estimated from the chromatogram. Comparing the distance between the component peak and the to-peak to the distance between the t0-peak and the injection point yields the desired result. The retention factor k depends on:
- Sample component and stationary phase
Since the k-value describes the retention behavior of sample components, it is determined by both the sample and the type of stationary phase. In fact, it is a measure for the degree of interaction between a sample component and the stationary phase.  Amount of stationary phase
The retention time of a sample component that is retained by a given stationary phase is dependent on the amount of stationary phase. A greater amount of stationary phase (thus thicker film) leads to higher retention times and higher the k-values.
In order to separate two components on a given chromatographic system, it is necessary that those two components exhibit different retention behavior. The term which represents this difference is called selectivity. The selectivity factor (α) is defined for peak pairs (two closely eluting compounds) and is given by the ratio of the retention factors of the more retained component (k2) and the less retained component (k1): ![]()
The animation - on the left - named: 'Selectivity (A)' helps to understand.
The selectivity factor is always equal to or greater than one. If the selectivity equals one the two sample components cannot be separated and their peaks will overlap. The higher the selectivity, the larger the difference in retention times of the two peaks. A higher selectivity always implies a better separation. Whether a baseline separation is achieved, however, also depends on the peak width.Selectivity is, essentially, a measure of the relative retention of two closely eluting compounds. The selectivity of an HPLC system is a result of the properties of the components, the column and of the mobile phase. Changing the type of modifier, pH, or temperature strongly affects the selectivity of the system.
By changing the selectivity factor in the simulation, its effect on the separation of the peaks becomes evident:
- For α = 1, the peaks overlap each other entirely.
- For α > 1.0 the two separated peaks separate
- For α = 1.4 the retention factor k of the second peak of interest is 40% more than the retention factor of the first peak.
Efficiency
The ability to produce narrow peaks is called the ![]() efficiency of a column. An efficient column produces narrow peaks. This means that all molecules of the same compound elute within a narrow time window.
efficiency of a column. An efficient column produces narrow peaks. This means that all molecules of the same compound elute within a narrow time window.
The efficiency of a column is quantified by the theoretical plate number ![]() Nth. The so-called '
Nth. The so-called ' ![]() plate theory' assumes that a column is divided into a number of equilibria in narrow zones called theoretical plates.
plate theory' assumes that a column is divided into a number of equilibria in narrow zones called theoretical plates.
After the separation, every component is represented as one peak in the chromatogram. If peaks were infinitely narrow, the various peaks could not overlap, which means that there would be a perfect chromatographic separation. Unfortunately, this is never the case: peaks always have a certain width due to various causes e.g. molecular diffusion. In the ideal situation a peak has a Gaussian - symmetrical - shape.
Peak heigth vs. Plate number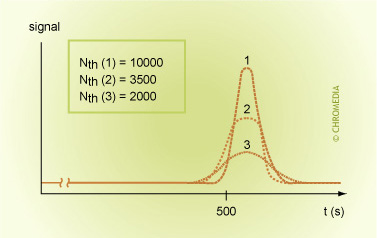
The width of a peak is not dependent on the peak area or height. This is related to the injected amount of the component. If the same amount of a component is injected onto three columns of similar type but with different efficiency:
- The column with the highest efficiency (highest number of plates) will deliver the highest and narrowest peak (1),
- The column with the lowest efficiency exhibits the widest peak and the lowest peak height (3).
- The total peak area of the three peaks are equal.
- The retention time of the three peaks is the same in all three cases, assuming that the properties of the stationary phase of all three columns are the same.
The maximum of the curve is the retention time of the component concerned; it is a mean value. Peak broadening, or band broadening, is related to the fact that each component represents a large number of identical but individual molecules. Chromatography is, in fact, the separation of groups of molecules.
Rules of thumb:
- In general the separation becomes better as the number of plates increases. The plate number provides information about the separation power of a column.
- A high plate number (Nth) provides better resolution.
- A column providing narrow peaks is said to be efficient. Such a column has a high separation power.
- When sample components 'travel longer' through the column, the peaks will appear further away from the starting point on the chromatogram (further from the t0 time), and the peaks become wider (peak broadening).
- Columns generating broad peaks are not efficient.
Plate height H and plate number N
The ![]() efficiency of a column, meaning the ability to produce narrow peaks, can also be quantified by the plate height: the length of column divided by the theoretical plate number: H = L/Nth
efficiency of a column, meaning the ability to produce narrow peaks, can also be quantified by the plate height: the length of column divided by the theoretical plate number: H = L/Nth
In which:
H (or HETP (Height Equivalent to a Theoretical Plate) = plate ![]() height (in HPLC is usually expressed in micrometers, µm)
height (in HPLC is usually expressed in micrometers, µm)
L = column length
Nth = theoretical plate number (or in short the plate number N).
Peak width and plate height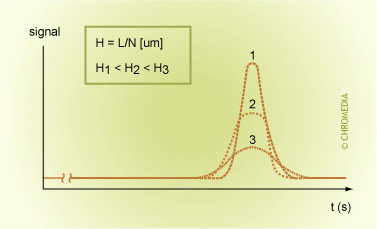
- H is inversely proportional to the plate number.
- The higher the plate number, the better is the separation and the efficiency.
- The smaller the plate height H, the more efficient is the column.
Also, the “dead volume” of the instrument has an influence on the overall efficiency. If the instrument uses an excessive length of connecting tubing, for instance, the overall efficiency is degraded. Also, keep in mind that the absolute number of plates of a column is not relevant if the column length and the particle size of the packing are not specified.
The efficiency of a column or a chromatographic system is inversely related to the number of ![]() theoretical plates (Nth). The efficiency of a column can be expressed in the 'height (actually the width) equivalent to one theoretical plate' or (Height Equivalent to a Theoretical Plate, HETP, or H). It is calculated by dividing the length of the column by the theoretical plate number Nth.
theoretical plates (Nth). The efficiency of a column can be expressed in the 'height (actually the width) equivalent to one theoretical plate' or (Height Equivalent to a Theoretical Plate, HETP, or H). It is calculated by dividing the length of the column by the theoretical plate number Nth. ![]()
L = column length in mm.
Nth = (theoretical) plate number
The plate number can be calculated from a chromatogram as follows:
- Measure tr in the chromatogram.
- Measure or calculate the standard deviation σ, which is half the width of a Gaussian distribution at 0.606 of the height, i.e. the width at 0.606 h equals twice the standard deviation. Since these widths are difficult to measure in practice, we use the width at half height W1/2.
- For a Gaussian peak, a fixed relationship exists between W1/2 and σ: W1/2 = 2.354 σ and Wb = 4 σ
- Substituting these values in the equation for the plate number gives the following relationships:
![]()
Peak width and retention time can be measured with units of minutes or seconds.
Peak model of the GAUSS-curve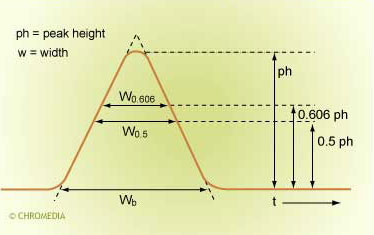
The plate Height H is inversely proportional to the plate number N. Assuming a fixed column length, a larger plate number means a smaller plate height.
Some general rules of thumb:
- For the determination of the plate number, it is advised to select a (symmetrical) peak in the chromatogram with a retention factor k > 5.
- HPLC columns exhibit between 1000 and 15,000 plates per column.
- The higher the plate number, the better the efficiency, the narrower the peaks and thus, the greater the separation power.
- Peak broadening degrades separation quality. Two adjacent peaks can overlap as the last molecules of the first compound mix with the first molecules of the second compound- the separation between the two compounds is not complete.
- As the peaks broaden, the chance of overlap with adjacent peaks increases. A column that provides narrow peaks has good chromatographic properties and is called efficient. Such a column has a great separation power. Broad peaks, on the other hand, indicate poor efficiency.